
Incidents
The Incidents tab of Microsoft Security View shows the incidents and alerts of Microsoft Defender XDR and Microsoft Sentinel of the last 60 days. It helps you understand how far an attack has gone, see which incidents belong to the same attack and read each incident in full, without opening the Defender portal.
A bar at the top of the tab tells you when the data was last updated and where it comes from. The incident list is updated every hour.
Open Alerts by Service
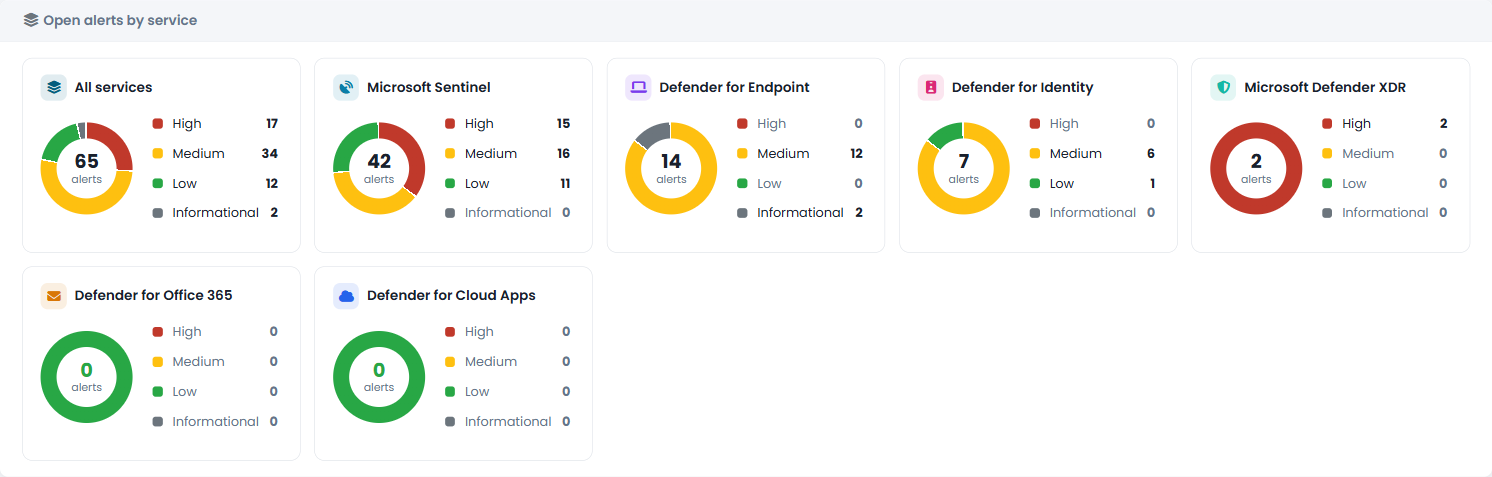
The Open alerts by service card summarizes the open alerts by service — Microsoft Sentinel, Defender for Endpoint, Defender for Identity, Defender for Office 365, Defender for Cloud Apps and Microsoft Defender XDR — with the split by severity. The main services are always shown, in green when they have no open alerts. Click a service or a severity to filter the MITRE ATT&CK techniques and the incident list together; click again to remove the filter.
MITRE ATT&CK Techniques
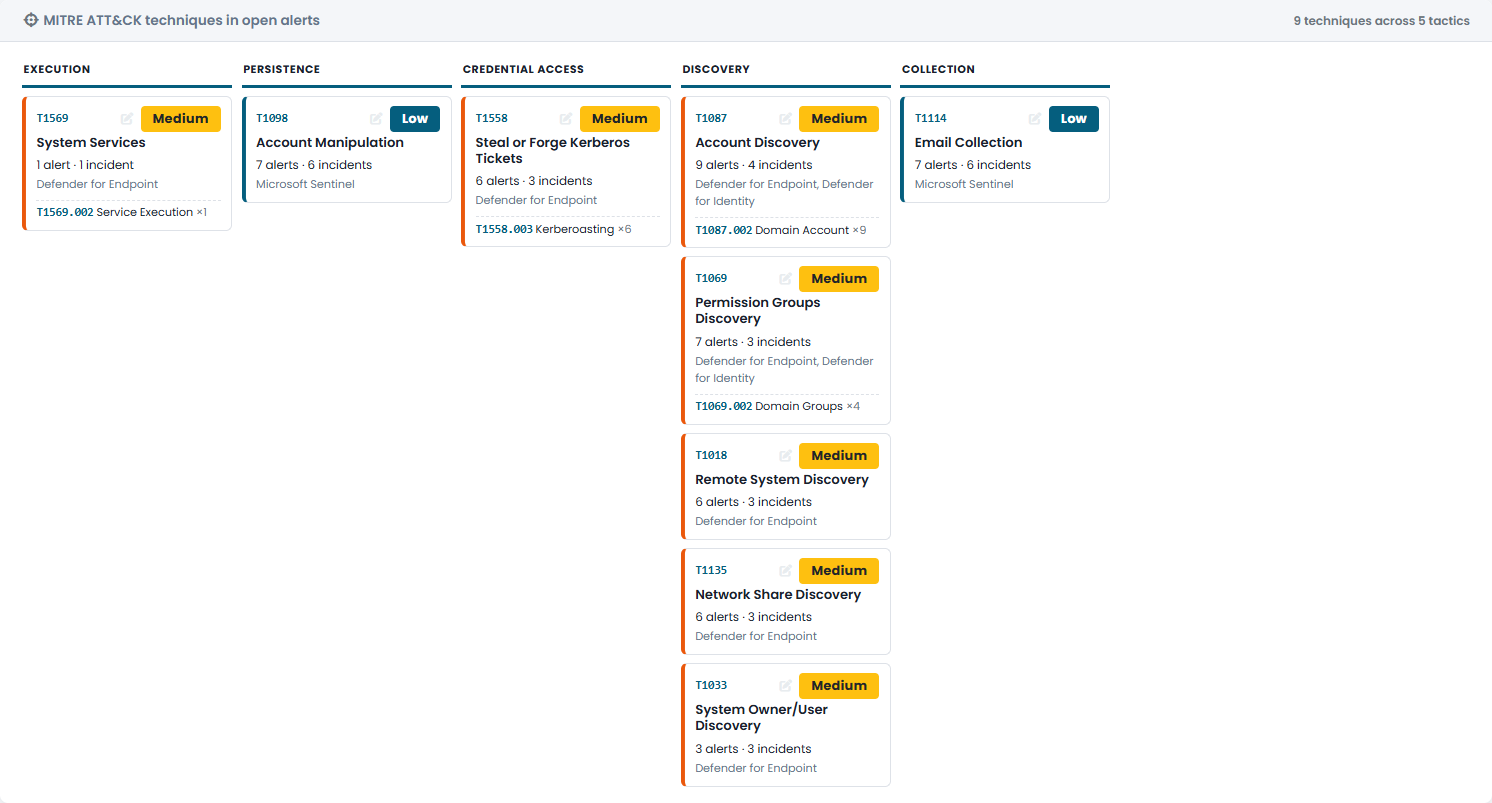
The MITRE ATT&CK techniques in open alerts strip arranges the techniques found in the alerts by phase of the attack, from initial access to impact. At a glance you see how far an attacker may have gone: techniques in the later phases deserve immediate attention. For each technique you see its name, the highest severity, the services that reported it and how many alerts and incidents involve it.
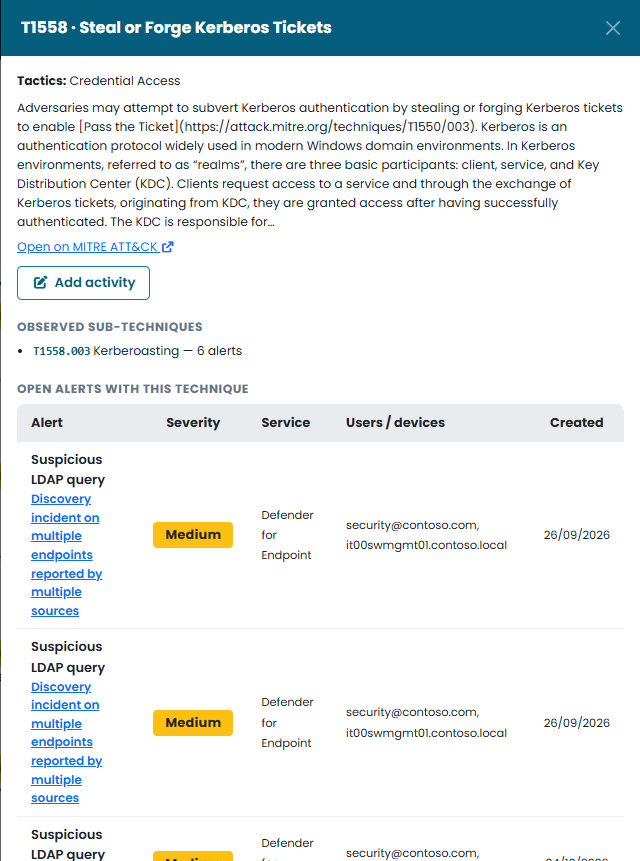
Click a technique to open its details:
- the description of the technique and the link to MITRE ATT&CK;
- the sub-techniques observed and the open alerts that report it, with users and devices involved;
- queries to investigate, taken from the CyberGuard KQL catalogue: open them in the KQL editor with one click, or copy them;
- Add activity, to record your investigation in the Workspace.
Incident List
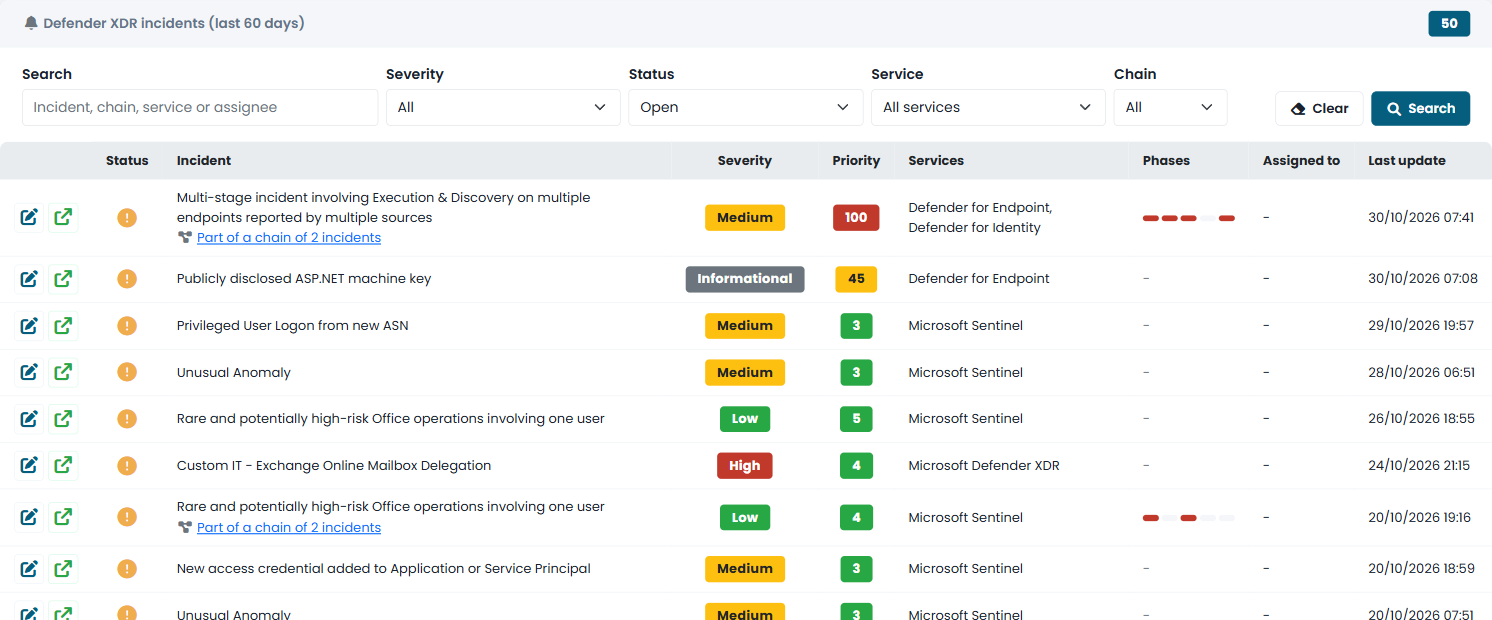
All incidents of Microsoft Defender XDR and Microsoft Sentinel are in one list, the most recently updated first. When the tab opens, the list shows the open incidents. For each incident you see its status, severity, priority, the services that reported it, who it is assigned to and when it was last updated.
Incidents are often pieces of the same attack: an alert on a device, a suspicious sign-in of the same account, a mailbox rule created shortly after. CyberGuard correlates them into attack chains. When an incident belongs to a chain, the list shows Part of a chain of N incidents below its title, and the Phases column shows how far the chain has gone. Click the link to open the attack chain.
Use the filters to narrow the list:
- Search by incident, chain, service or assignee;
- Severity and Status (open or resolved);
- Service, the same filter as the cards above;
- Chain: only the incidents that belong to an attack chain, or only the isolated ones.
The buttons in the first column open the incident in Defender or record your work in the Workspace.
Incident Details
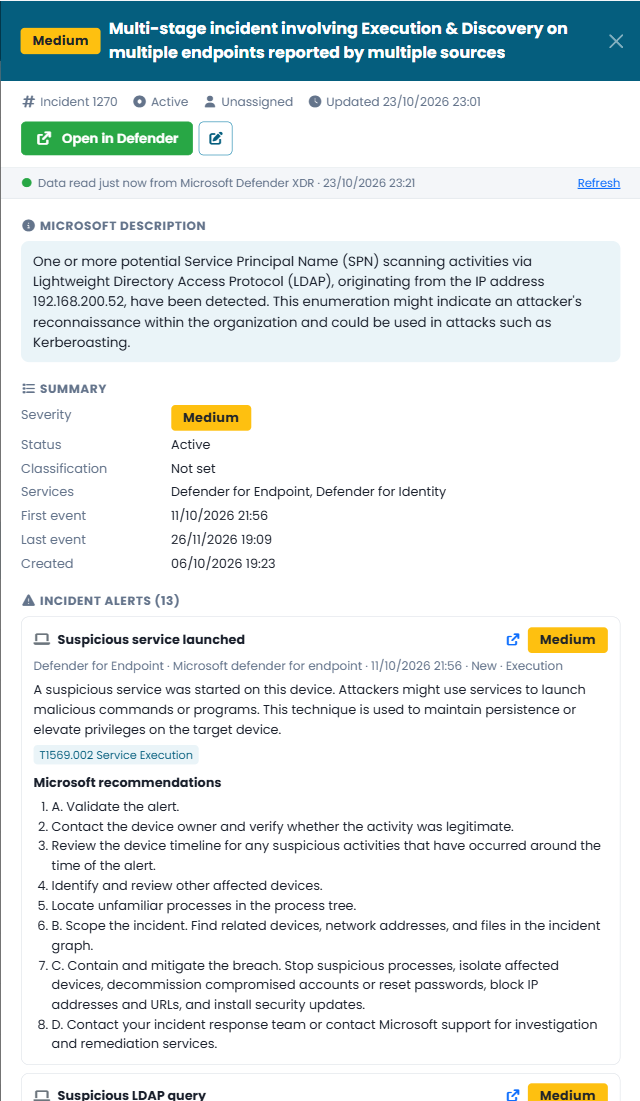
Click an incident to open its details on the right. They are read at that moment from Microsoft Defender XDR — Refresh reads them again — and, if Defender cannot be reached, the panel shows the data saved by CyberGuard.
- Summary — status, severity, assignee, classification, first and last event, tags.
- Microsoft description of the incident.
- Incident alerts — each alert with its MITRE ATT&CK techniques and the Microsoft recommendations; Open the alert in Defender when you need the full investigation.
- Involved entities, grouped by type: users, devices, IP addresses with their country, mailboxes, files, processes and applications.
- Timeline of the incident.