
Threat Intelligence
The Threat landscape section of the Dashboard shows global indicators collected from public threat intelligence sources. They help you prioritize your analysis, but they describe the threat landscape in general: they do not mean that your organization is exposed.
The data covers the last 60 days and is updated at 06:00, 13:00 and 20:00; cloud service incidents are checked every 15 minutes. For older history, the links at the bottom of the section lead to the original sources. The badge on the right shows how many sources are working.
Indicators
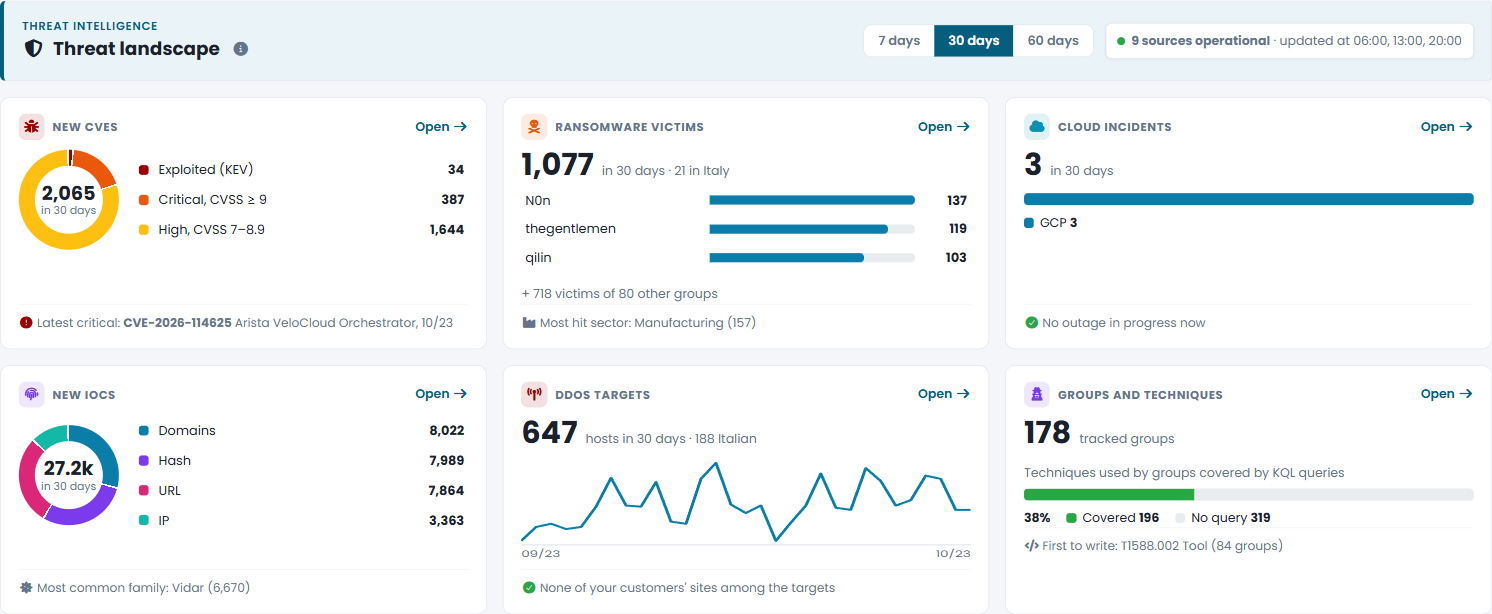
Choose the period — 7, 30 or 60 days — with the buttons at the top: it applies to all indicators. Each indicator shows what its number is made of:
| Indicator | What it shows |
|---|---|
| New CVEs | Vulnerabilities published in the period, split by severity and exploitation, with the latest critical one. |
| Ransomware victims | Victims of the period by ransomware group, and how many in Italy. |
| Cloud incidents | Incidents on the main cloud services by provider, and the outages in progress now. |
| New IOCs | New indicators of compromise by type, with the most common malware family. |
| DDoS targets | Hosts targeted by the NoName057(16) group, day by day, and how many of your websites are among them. |
| Groups and techniques | Tracked threat groups, and how many of the techniques they use are covered by the CyberGuard KQL queries. |
Tabs
In every tab, a column of charts next to the table shows where to look: click a slice or a bar to filter the table.
| Tab | What it shows |
|---|---|
| News | The events of the period: new critical CVEs, vulnerabilities added to the exploited catalog, ransomware in Italy, cloud incidents, campaigns. Events that concern you — ransomware in your sector, your websites among the DDoS targets — are at the top. Filter the list by type with the buttons above it. |
| Vulnerabilities | Vulnerabilities known to be exploited, from the CISA KEV catalog, and high-severity vulnerabilities (CVSS 7 or more) published in the last 30 days, even before CISA adds them to the catalog: these show Not in KEV and become Exploited when they enter it. The tab opens filtered on critical vulnerabilities (CVSS 9 or more); long descriptions are shortened to two lines, with an arrow to read them in full. |
| Actors | Tracked threat groups, their origin and the sectors they target. |
| Campaigns | Known attack campaigns and their status. |
| MITRE ATT&CK | The techniques of the MITRE ATT&CK framework, with the coverage of the KQL queries by tactic and the trend at the bottom. |
| Attacks | Recent ransomware victims. Sort the list by any column and filter it by group, sector, period, victim and country. Most active groups shows the ten groups with the most attacks in the last 30 or 60 days. |
| DDoS | The targets of the DDoS attacks of the NoName057(16) group (below). |
| IOC | Indicators of compromise (IP addresses, domains, URLs, hashes). They are shown in defanged form and are not clickable: do not paste them into a browser or into a tool that resolves them. |
| Cloud services | Open issues on the main cloud services, including Microsoft 365. |
| Documentation | Official Microsoft references and the threat intelligence sources used by the platform. |
DDoS
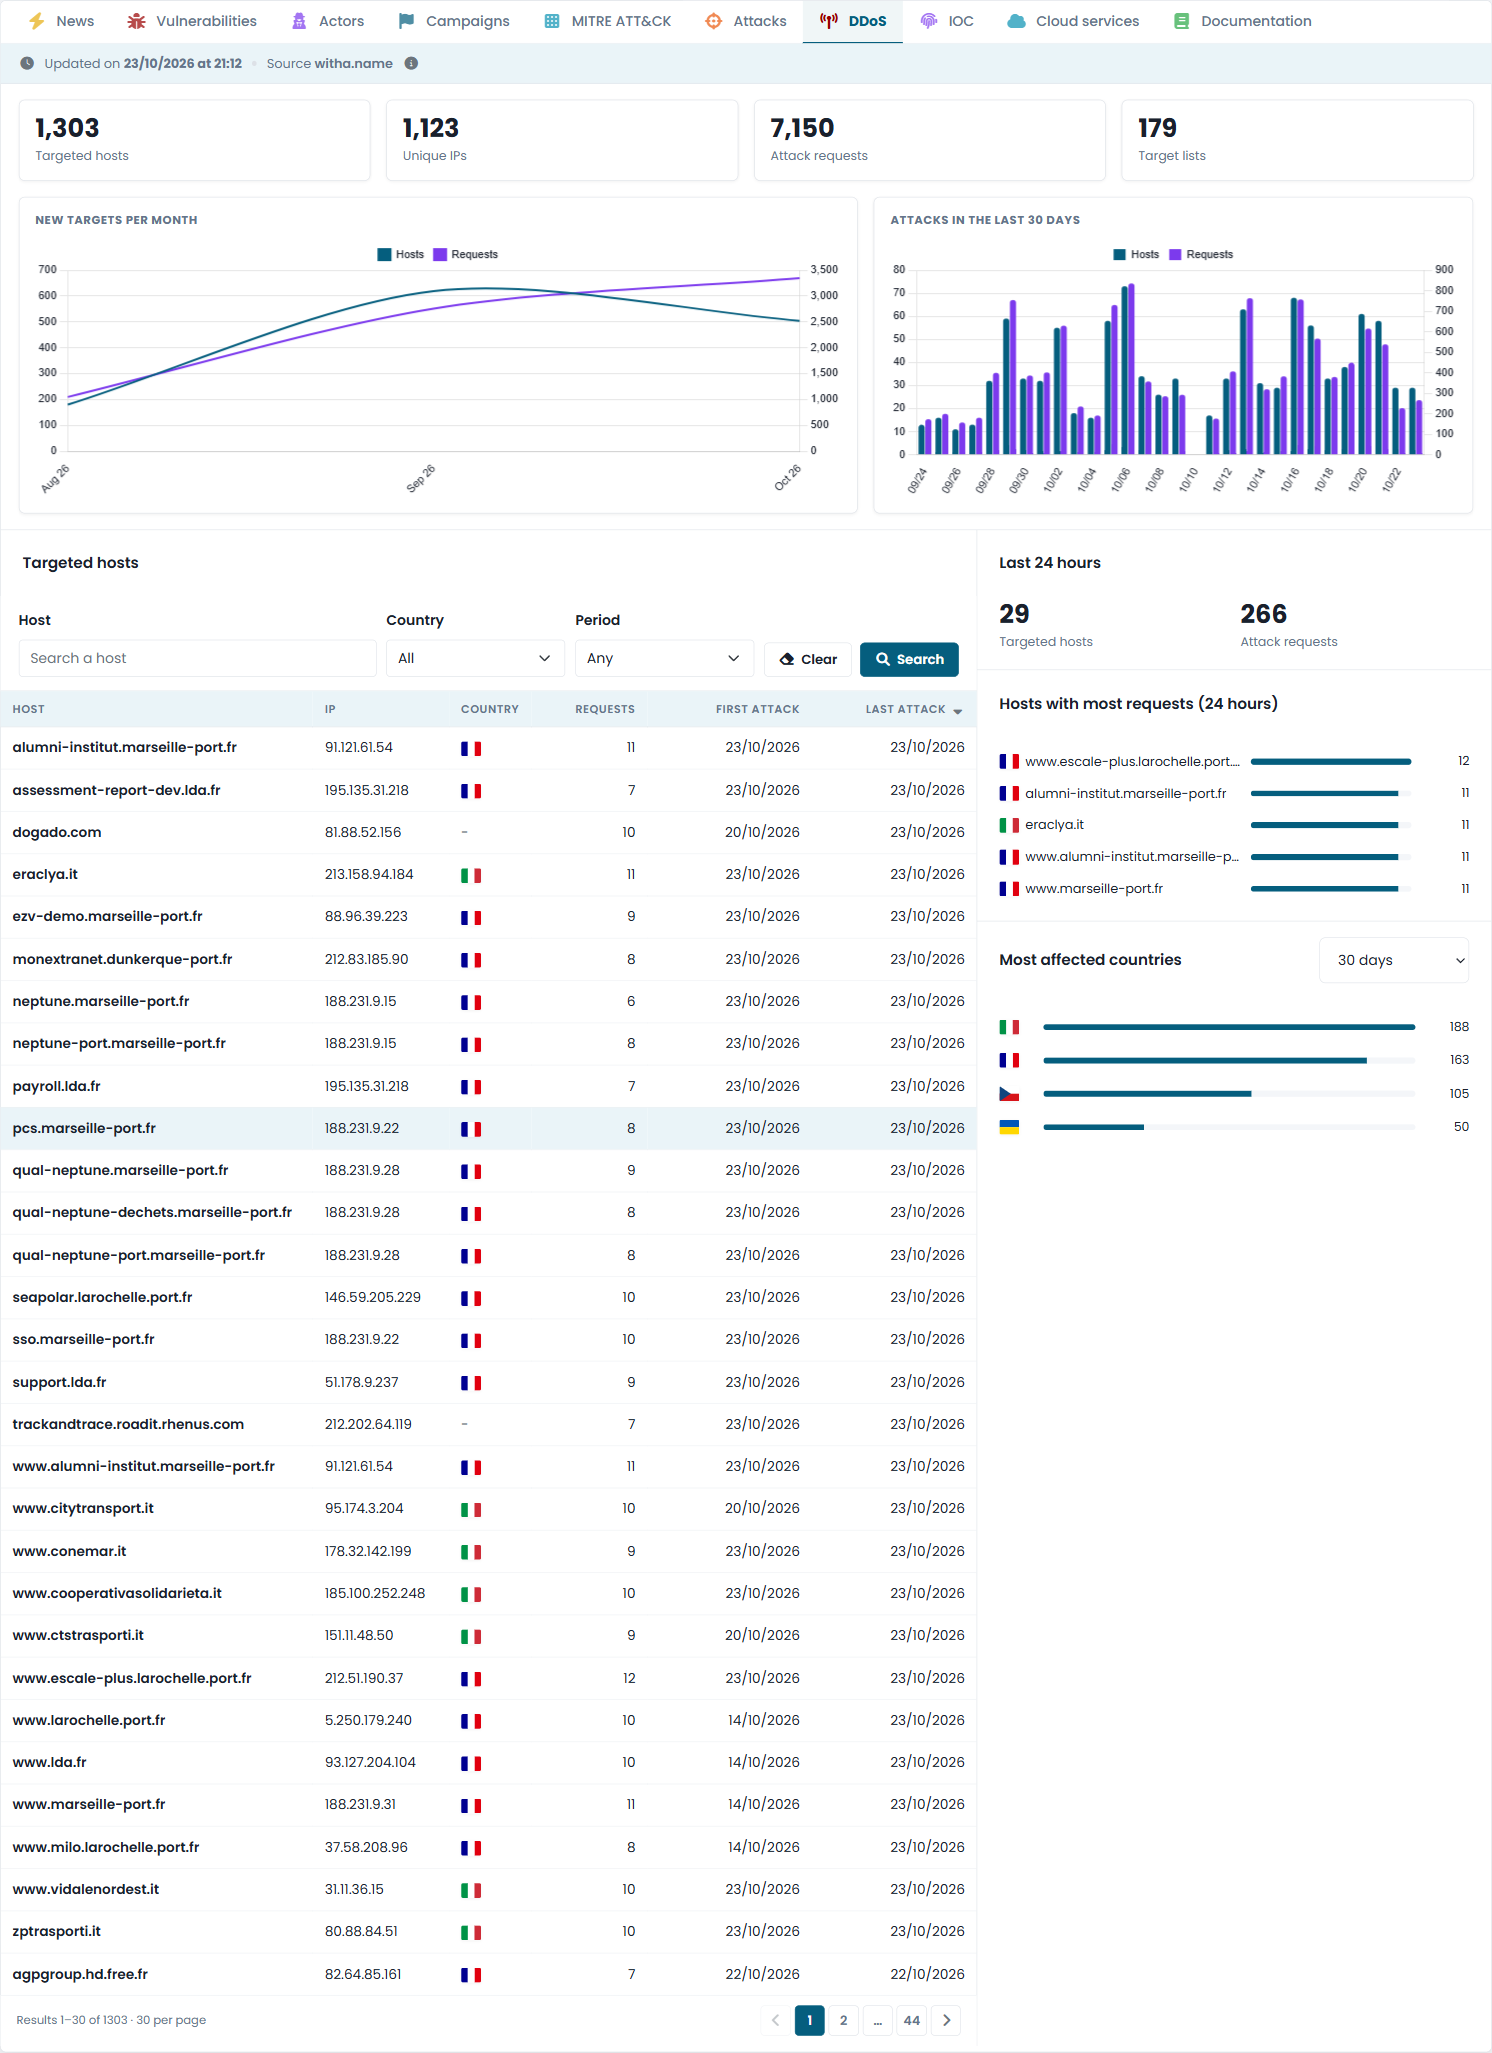
The DDoS tab shows the targets of the DDoS attacks run by the pro-Russian group NoName057(16), taken from the target lists its DDoSia botnet hands out to its participants:
- targeted hosts, unique IPs, attack requests and target lists;
- new targets per month and the attacks of the last 30 days;
- the last 24 hours, with the hosts that received the most requests;
- the most targeted countries. The country is derived from the national domain (.it, .fr, ...).
Search the list of targeted hosts by name, filter it by country and period, and sort it by any column.
To be warned when one of your websites is targeted, list your domains in Websites to monitor, in your Company Profile: the Dashboard shows an alert when one of them appears among the targets of the last 7 days.